
Language
default
Tool Type
Web app
License
AM331-A3
Version
1.0.0
Inter-American Development Bank

CadÚnico Analysis is an application designed to facilitate the understanding of social vulnerability through the automatic construction of six key indicators: Poverty, Extreme Poverty, Vulnerability, Lack of Income, Lack of Housing and Gini Coefficient. Through interactive graphs, it allows detailed exploration of data by time and location, supporting informed decision making. Faced with the complexity of managing large volumes of data on social vulnerability, such as those provided by CadÚnico in the Municipality of Recife, Analysis CadÚnico emerges as an effective solution. By transforming this data into easily understood indicators, the tool overcomes the limitations of conventional methods such as spreadsheets, streamlining the generation of valuable information for strategic decision making.
Although many national and subnational governments have rich databases on social vulnerability, analyzing this data is often complex and time-consuming, delaying the process of generating useful information for decision-making. Cadúnico analytics addresses this challenge by offering a platform that streamlines data analysis, enabling more efficient and informed decision-making.
Interactive Dashboard Interface: The application provides an interactive dashboard interface built using Dash. Users can navigate through various sections, make selections, and view dynamic content based on their choices. Temporal Analysis: The tool seems to offer a temporal analysis view where users can likely visualize data trends over time. Annual Overview: There's a section dedicated to annual analysis, where users might be able to explore data on a yearly basis, potentially selecting different indicators of interest. Neighborhood-Based Visualizations: The application provides neighborhood-based choropleth maps. Users can select a year and view data visualizations segmented by neighborhoods. Information & Context: The tool has a dedicated "Information" section that provides context and background information about the application and the data being analyzed. This section explains the key indicators and what they represent. Data Processing & Visualization Utilities: The tool offers various utility functions for data processing, including computing the Gini coefficient. It also provides functions for generating charts and maps, enhancing data presentation. Responsive Design: With the integration of Bootstrap, the dashboard is likely to be responsive, adjusting to different screen sizes and devices for an optimized user experience.
Built with Dash: leverages this Python framework to develop interactive and custom web applications. Integrates Bootstrap via Dash_Bootstrap_Components, ensuring a modern and responsive design. Processes data with Pandas and Numpy, enabling efficient manipulation. Incorporates Pyarrow to handle data in Parquet format and DASK for parallel computations. Visualizes data with Plotly, utilizing its interactive capabilities. Deploys with Gunicorn for production and manages configurations with Python-Dotenv.
Connect with the Development Code team and discover how our carefully curated open source tools can support your institution in Latin America and the Caribbean. Contact us to explore solutions, resolve implementation issues, share reuse successes or present a new tool. Write to [email protected]
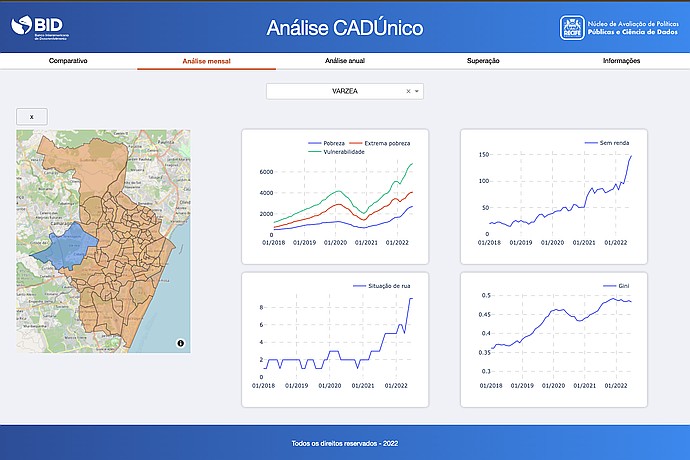
"Analysis CadÚnico" screen displaying poverty, extreme poverty, vulnerability, no income, homelessness, and Gini charts from 2018 to 2022 for VARZEA area in Recife. Includes a left-side map.
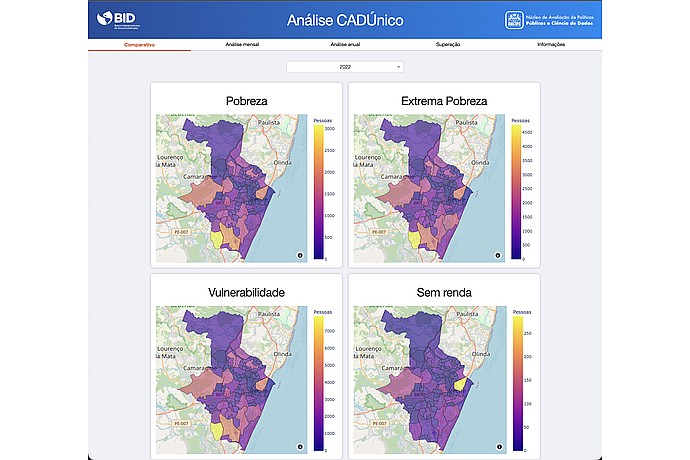
"Analysis CadÚnico" screen displays four maps of poverty, extreme poverty, vulnerability, and income-less in Recife, 2022. Each map uses a color scale to indicate the number of people affected.
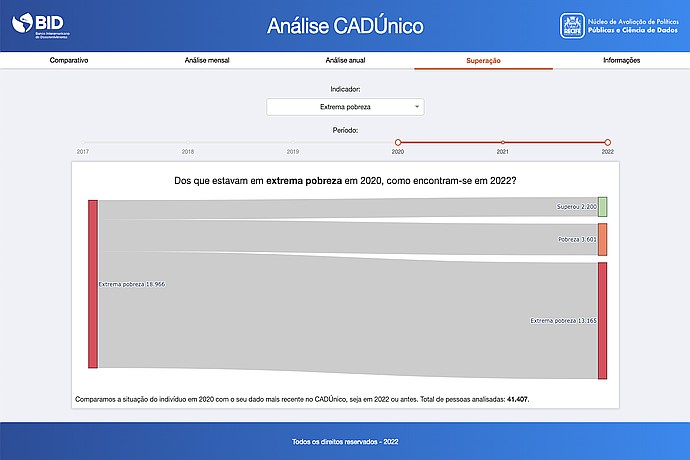
BID's "CadÚnico Analysis" graph shows that of 18,966 extremely poor people in 2020, 2,200 overcame it, 3,601 are poor, and 13,165 remain extremely poor in 2022. Total analyzed: 41,407.
Guide for implementation and analysis with CadÚnico.
IDB Technical Cooperation to support Brazilian cities with data-based tools.