Language
Javascript
Tool Type
Web app
License
Creative Commons Attribution 4.0
Version
1.0.0
Head of Cabinet of Ministers

Argentina energy is a tool that facilitates the visualization of the country's energy flow, showing how energy is produced, exported, transformed and consumed in the different sectors. This resource helps calculate efficiency ratios and plan long-term energy policies. The tool was created to highlight energy consumption and make it visually understandable for users. Argentine Energy
Energía Argentina addresses the need to understand the complex national energy system, facilitating the planning of efficient energy policies and the promotion of sustainability through data visualization and analysis.
Data Visualization: Provides interactive charts, graphs, and maps for exploring energy data. Data Filtering: Allows users to filter and customize data views based on various criteria. Energy Trends Analysis: Offers tools for analyzing energy consumption trends over time. Geographic Mapping: Displays energy-related data on interactive maps for regional insights. User-Friendly Interface: Ensures ease of use for a wide range of users, including non-technical stakeholders. Data Export: Enables users to export data and charts for further analysis and reporting. Data Sources Integration: Aggregates data from various sources, including government reports and utilities.
Web application accessible via modern browsers. Utilizes HTML, CSS, and JavaScript with frontend frameworks like React, Angular, or Vue.js. Implements backend technologies such as Node.js, Ruby on Rails, or Django. Employs relational or NoSQL databases for energy data storage. Incorporates visualization libraries like d3.js or chart.js for interactive charts. Integrates GIS tools for mapping. Secures user data with authentication protocols. Adopts open data standards for interoperability and accessibility.
Connect with the Development Code team and discover how our carefully curated open source tools can support your institution in Latin America and the Caribbean. Contact us to explore solutions, resolve implementation issues, share reuse successes or present a new tool. Write to [email protected]
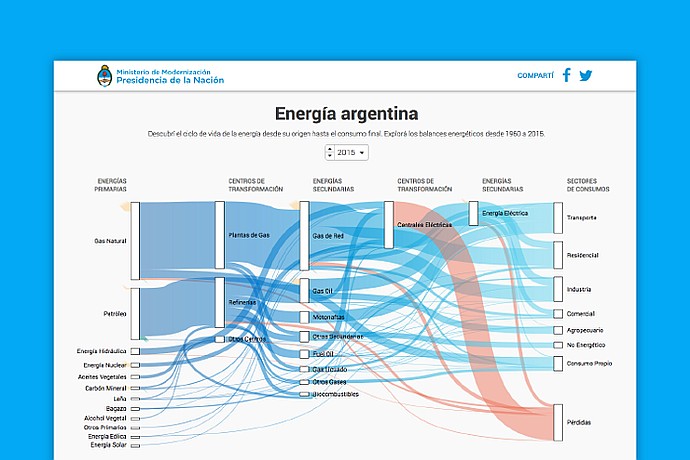
The image depicts the Argentine government's website featuring a resource that enables users to track the energy consumption lifecycle from the start date to a specified end date
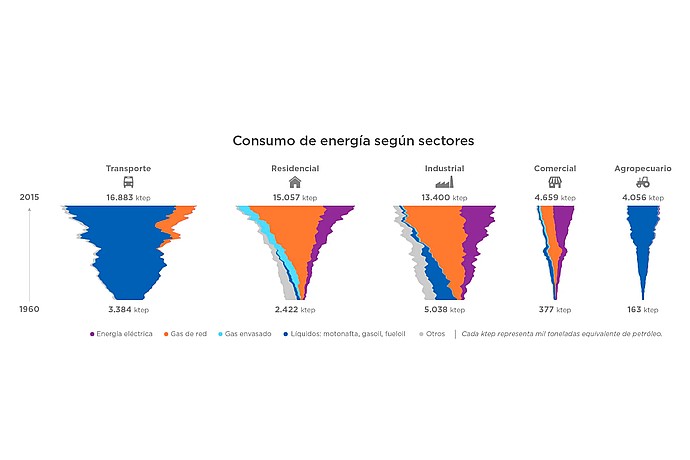
This image displays a colorful area chart depicting the energy consumption in Argentina by sectors including Transport, Residential, Industrial, Commercial, and Agricultural from 1960 to 2015.
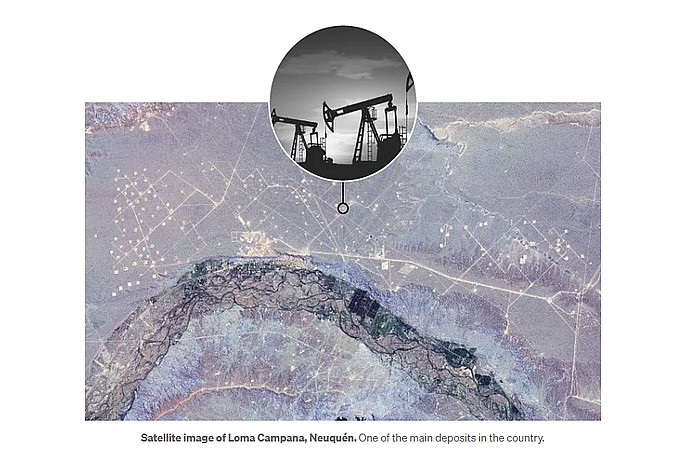
This image shows a satellite view of Loma Campana, Neuquén, highlighting the oil extraction infrastructure in one of Argentina's main hydrocarbon deposits.
Explore the life cycle of energy in Argentina from 1960 to 2015.
Details about the development and functionalities of the Energía Argentina tool.
Information on energy production and consumption in Argentina, used by the tool.