
Language
Jupyter Notebook, Python
Tool Type
API, Manual
License
GNU General Public License version 3
Version
v4.1.1
CLIMADA Project
The CLIMADA Project is a software framework for climate risk assessment and adaptation planning. It enables researchers, policymakers, and businesses to analyze the impacts of natural phenomena and explore adaptation strategies, offering high-resolution global coverage of climate hazards. The tool includes modules for calculating probabilistic impacts and damage functions, as well as a data API for accessing historical and probabilistic event sets. CLIMADA is compatible with Windows, macOS, and Linux, and is recommended for installation in a separate Conda environment.
CLIMADA solves the problem of assessing climate risks and adaptation options by providing an open-source software framework that enables researchers, policymakers, and businesses to analyze the impacts of natural disasters and explore adaptation strategies, facilitating informed decision-making in the context of climate change.
CLIMADA is an open-source software program that allows for the assessment of climate risks and adaptation options. It works by simulating the impacts of natural phenomena at high resolution, using historical and probabilistic data. Users can analyze potential damage and explore adaptation strategies for different climate scenarios.
CLIMADA uses open standards such as the Data API to provide access to historical and probabilistic datasets of extreme weather events. It is also based on Python and follows the guidelines of the GNU General Public License Version 3, promoting transparency and collaboration in software development.
Connect with the Development Code team and discover how our carefully curated open source tools can support your institution in Latin America and the Caribbean. Contact us to explore solutions, resolve implementation issues, share reuse successes or present a new tool. Write to [email protected]
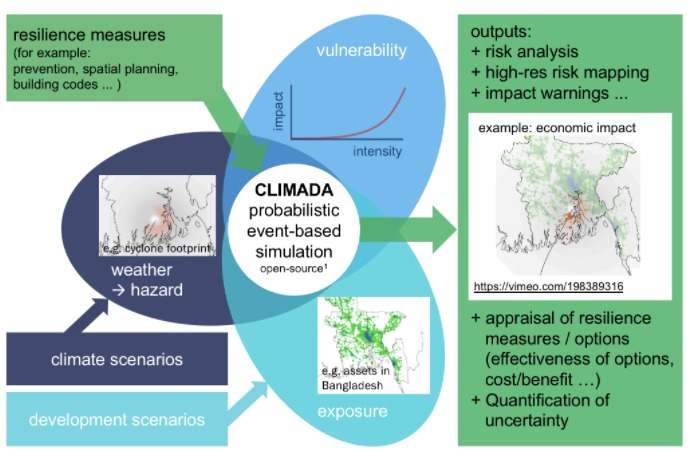
Diagram showing how CLIMADA integrates climate scenarios, hazards, vulnerability and exposure to generate risk analysis and assess resilience measures.
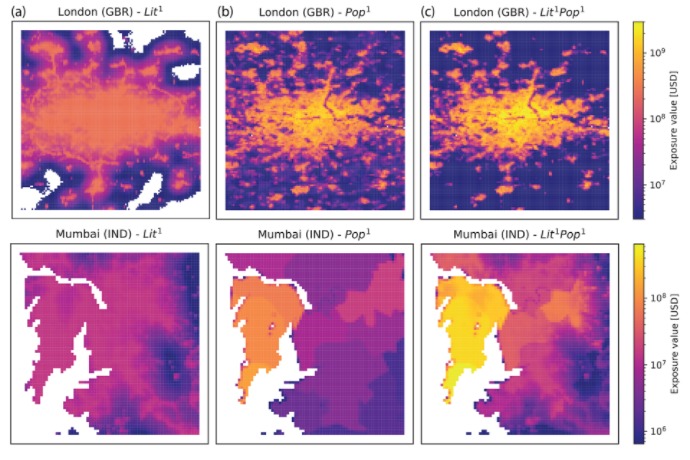
Maps showing exposure value in USD based on luminosity (Lit), population (Pop), and their combination (Lit*Pop) for London and Mumbai.
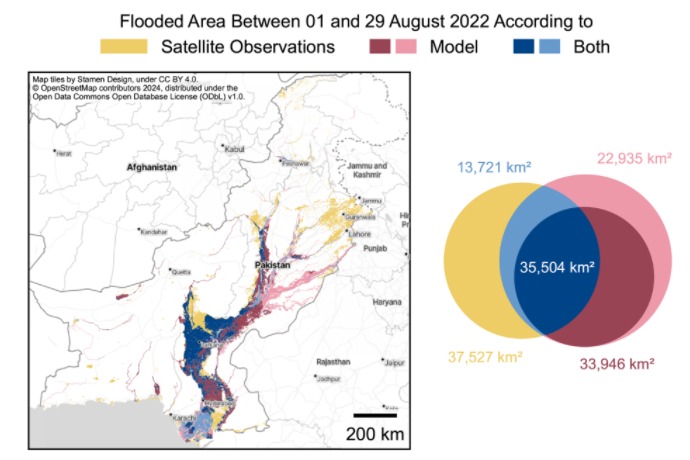
Comparison of flooded areas observed by satellites and estimated by models in Pakistan during August 2022.
Overview and tool ecosystem.
User guides, tutorials and examples.
Technical description of the model and validations.