
Language
Stata
Tool Type
Algorithm
License
AM331-A3
Version
1.0.0
Inter-American Development Bank

The Latin American and Caribbean Harmonized Household Survey Collection includes programming scripts to harmonize survey microdata, transforming original variables into standardized formats that facilitate accurate and consistent comparisons between 26 countries in the region from 1986 to date. This resource is essential to generate comparable data and indicators between countries, helping to monitor the living conditions of the population and the effects of public policies. It favors informed decision-making and promotes regional collaboration in research and public policies.
It generates comparable data and indicators between countries, facilitating the monitoring of living conditions and the effects of public policies in Latin America and the Caribbean. This enables comparative analysis and effective policy formulation, overcoming barriers previously imposed by data disparities.
Harmonized Data: The collection offers data that is standardized and harmonized across surveys, making it easier to compare and analyze information from different sources. Diverse Indicators: It typically covers a wide array of indicators related to household demographics, income, education, and more, ensuring comprehensive coverage. Data Accessibility: Users can access and download the harmonized data for their research and analysis. Interoperability: The data is often structured to work seamlessly with various analytical tools and software. Cross-Country Comparisons: Policymakers and researchers can easily compare and analyze data across countries, facilitating regional studies. Documentation: The collection may include documentation to help users understand the data sources and methodology.
STATA scripts for statistical data analysis, indicator calculation, and manipulation by gender, area, and education. Applies open methods using widely adopted commercial software.
Connect with the Development Code team and discover how our carefully curated open source tools can support your institution in Latin America and the Caribbean. Contact us to explore solutions, resolve implementation issues, share reuse successes or present a new tool. Write to [email protected]
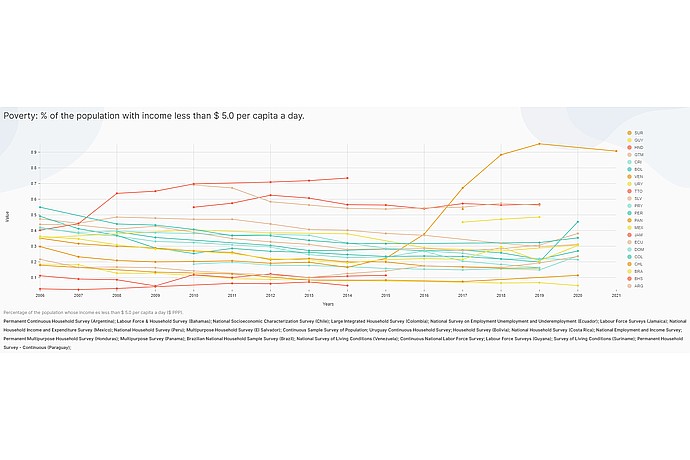
This image is a line graph showing the percentage of people living on less than $5.50 per day in different countries from 2000 to 2018. The graph shows the trend in poverty levels over the years. The x-axis represents years, while the y-axis shows percentages. The title “Poverty: % of the population with income less than $5.50 per capita a day” is displayed at the top1
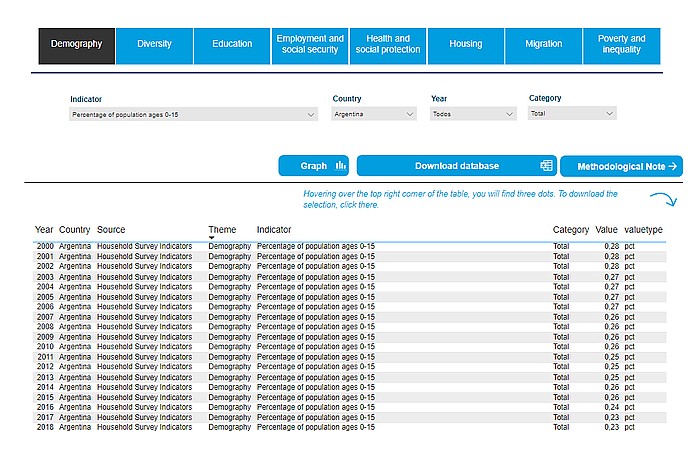
This image shows the percentage of population ages 0-15 in Argentina from 2000 to 2018
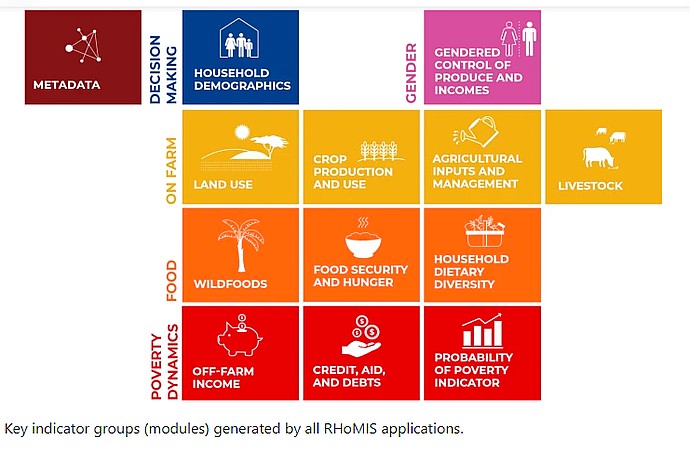
This image represents key indicator groups in colorful blocks, each associated with different aspects of rural household surveys and data collection
Harmonized demographic, economic and social data for 26 LAC countries.
Code4Dev: Learn how to implement the open source tool IDBSocialData and Code4Dev: Learn about IDB Social Data