
Language
Docker
Tool Type
Web app
License
AM331-A3
Version
1.0.0
Inter-American Development Bank

Congestiómetro is a tool developed by the IDB for the Government of the City of Buenos Aires, designed to optimize the planning and management of urban traffic. It uses data from the Waze application, allowing a broad and detailed view of vehicle flow without the need for specialized hardware, making it easier to adapt to other cities. This tool arises in response to the challenges of vehicle congestion in large cities, offering a practical solution to improve urban mobility. By taking advantage of real-time traffic data, the Congestiometer enables more efficient traffic management, contributing to the reduction of costs, travel times and polluting emissions, thus promoting a better quality of life and a sustainable approach to urban planning.
Traffic congestion is a common urban challenge. Congestiometer addresses this problem by providing a platform to monitor and analyze traffic data, enabling data-driven decisions and congestion mitigation.
Traffic Data Analysis: Congestiómetro enables users to analyze traffic data, identify congestion hotspots, and make informed decisions. Congestion Mitigation: The platform often includes features for addressing traffic congestion through data-driven interventions. Community Engagement: It encourages community participation in monitoring and addressing traffic congestion issues.
Built with Caddy, it functions as a web server and reverse proxy, enhancing efficiency and security. Utilizes PostgreSQL with PostGIS for spatial database management, ensuring data interoperability. Implements Hasura to facilitate GraphQL services, optimizing data access. Developed with NodeJS, TypeScript, and Express, it supports the administrative backend. Employs Angular and Angular Material for the front-end, ensuring a modern interface. Integrates Python, Flask, and TensorFlow for the model backend, enabling advanced analytics.
Connect with the Development Code team and discover how our carefully curated open source tools can support your institution in Latin America and the Caribbean. Contact us to explore solutions, resolve implementation issues, share reuse successes or present a new tool. Write to [email protected]
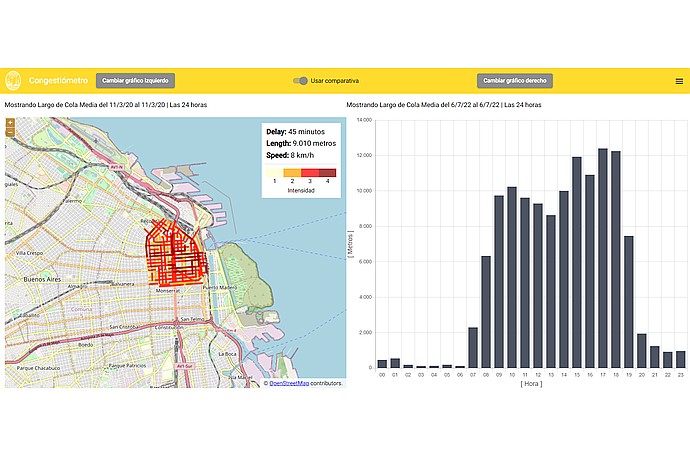
Buenos Aires map with heavy traffic in red (45 min delay, 9,010 m, 8 km/h). Bar graph shows congestion by hour, highlighting peak activity between 7 and 18 hours.
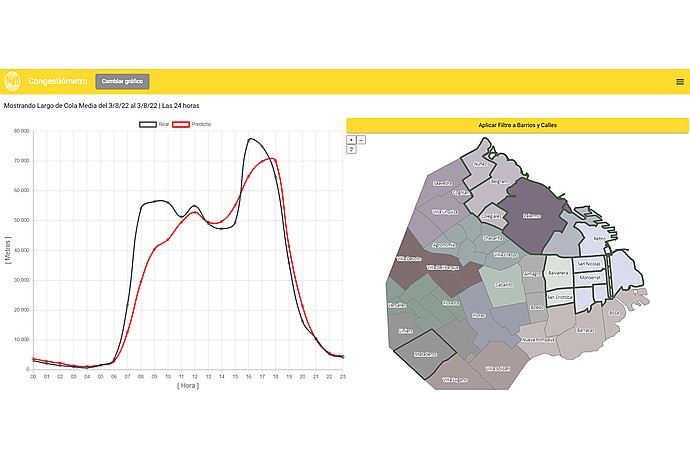
"Congest-o-meter" screen with queue length chart in meters per hour, showing actual and predicted values for 3/8/22. Map of Buenos Aires on the right with visible neighborhood names.

This image represents a Docker Compose infrastructure for microservices in scalable containers, detailing logical connections and components involved in encrypted client connections
Code4Dev Webinar: Learn about Congestiometer
Technical document to deploy the tool in other cities.
Official document that reports its use during the pandemic.
Details of the IDB project that supports the development of the Congestiometer.