
Language
Python
Tool Type
Algorithm
License
AM331-A3
Version
1.0.0
Inter-American Development Bank

Coronavirus Impact Toolbox uses Waze data to calculate Traffic Congestion Intensity (TCI) and monitor the effects of social distancing. This software processes traffic data to visualize in real time how preventive measures affect urban mobility and congestion. It provides valuable information for policymakers and public health, facilitating the adaptation of strategies in response to the dynamics of the COVID-19 pandemic.
Coronavirus Impact Toolbox addresses the lack of detailed analysis of the impact of social distancing policies on urban mobility, providing an essential tool for informed decision-making during public health emergencies.
Data Analysis: The toolbox supports data analysis related to the economic and social impacts of COVID-19. Policy Assessment: Users can assess the effectiveness of policy measures and interventions. Resource Repository: The toolbox serves as a repository of resources, research, and data related to the pandemic.
Built with Python, R, and Stata, it leverages these technologies for data analysis and manipulation. Allows data download manually or via scripts in Python and R, facilitating access and processing. Integrates Waze for Cities data to assess traffic congestion, ensuring effective interoperability. Adopts an open-source license under Creative Commons IGO 3.0, promoting reuse and adaptation.
Connect with the Development Code team and discover how our carefully curated open source tools can support your institution in Latin America and the Caribbean. Contact us to explore solutions, resolve implementation issues, share reuse successes or present a new tool. Write to [email protected]
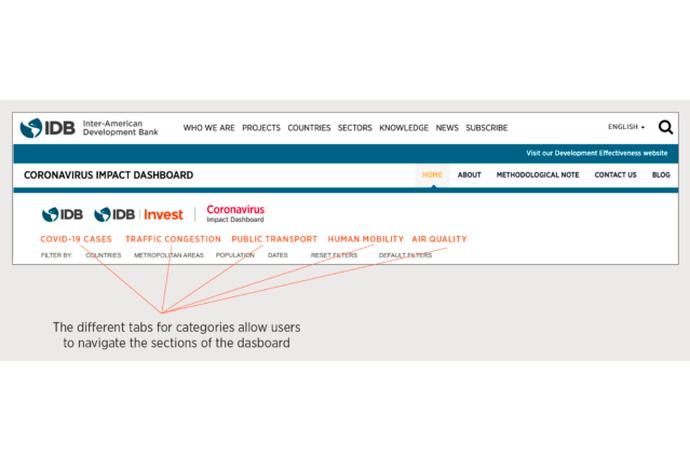
This image shows the "Coronavirus Impact Dashboard" on the Inter-American Development Bank website with tabs like COVID-19 cases, traffic, and air quality for user navigation.
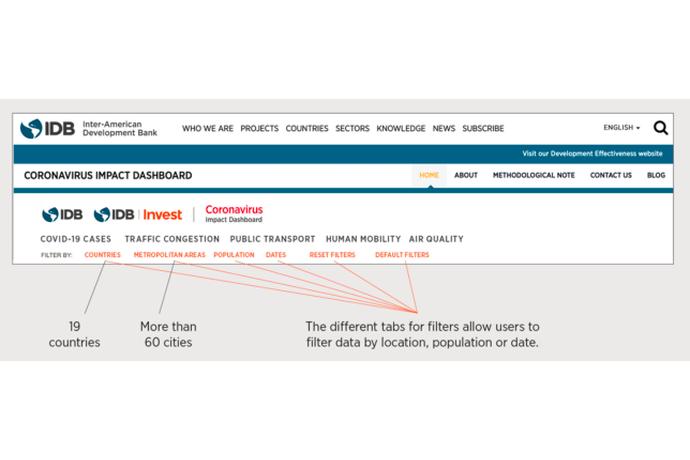
The image displays the "Coronavirus Impact Dashboard" from the Inter-American Development Bank, with tabs to filter data by COVID-19, transportation, mobility, and air quality in 19 countries and 60 cities.
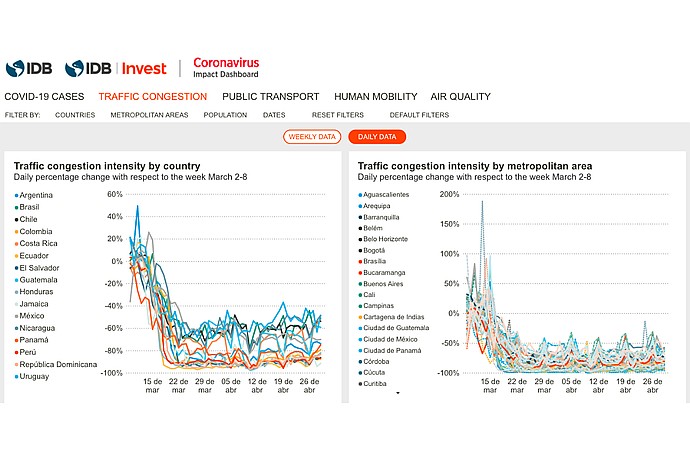
This image displays two line graphs comparing daily traffic congestion intensity by country and metropolitan area, related to COVID-19 impacts on mobility.
Use of open data to monitor urban mobility.
IDB open tools to confront COVID-19.