Language
Python
Tool Type
Web app, Manual, API, Spreadsheet
License
GNU Affero General Public License 3
Version
N/D
Project Tech4Dev

DALGO is a data management platform that enables organizations to automate data consolidation, transformation, storage, and visualization through a unified interface. It facilitates monitoring and impact assessment, allowing users to focus on analysis rather than repetitive manual tasks. With DALGO, teams can configure and monitor automated data pipelines, manage data sources, and perform transformations using tools like dbt. It also offers an analytics dashboard for visualizing data and collaborating with other team members, thus optimizing data-driven decision-making.
Dalgo solves the problem of manual and repetitive data management by automating data consolidation, transformation, storage, and visualization in a unified interface. This allows organizations to focus on using data to monitor and evaluate its impact, thereby optimizing their resources and efforts.
Dalgo is an open-source data platform that enables organizations to automate data consolidation, transformation, storage, and visualization through a unified interface. It facilitates data management by connecting diverse sources to a central repository, transforming them using DBT, and automating processes to optimize impact monitoring and evaluation.
Dalgo uses open standards such as SQL for data transformation and dbt (data build tool) for automating transformation processes. It also supports data warehouses such as BigQuery and PostgreSQL and can connect to more than 300 data sources, facilitating efficient data integration and management.

Connect with the Development Code team and discover how our carefully curated open source tools can support your institution in Latin America and the Caribbean. Contact us to explore solutions, resolve implementation issues, share reuse successes or present a new tool. Write to [email protected]

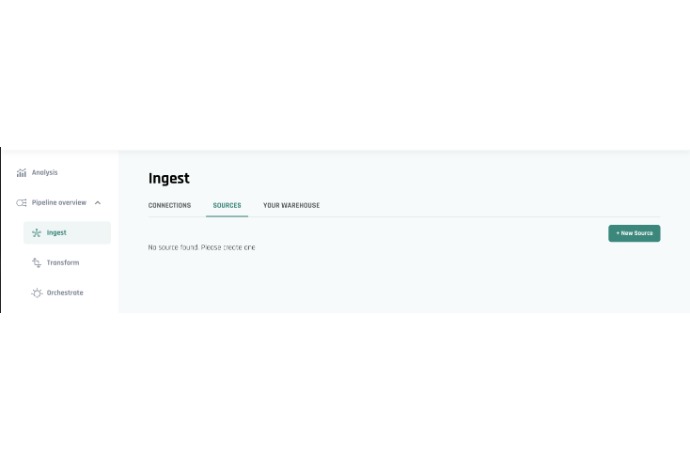
Use this section to connect new data sources and centralize them in your warehouse.

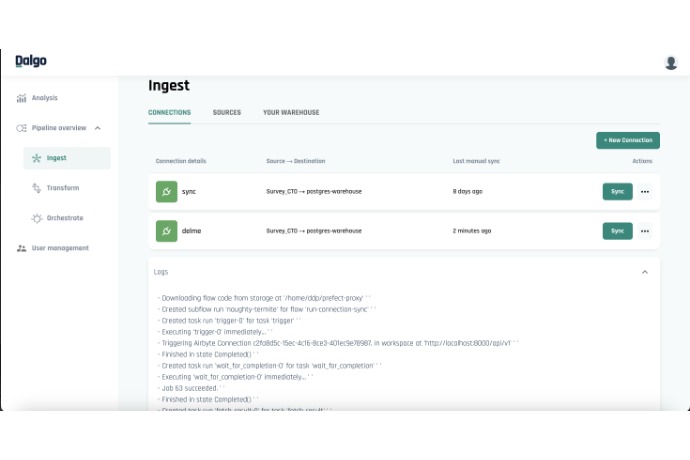
This view displays the connections between data sources and the warehouse, along with sync logs.

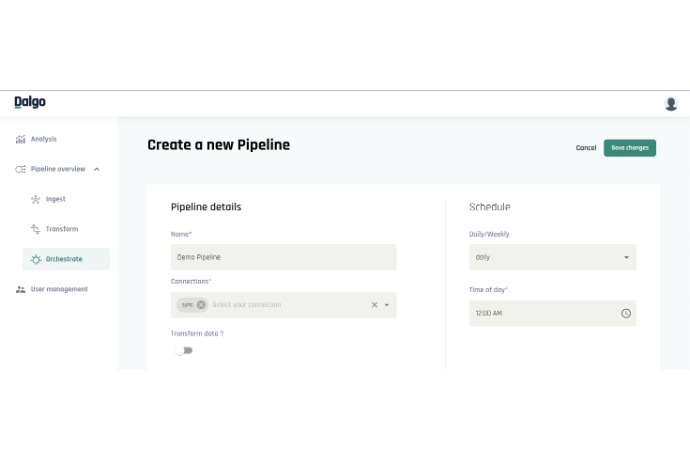
The image shows the interface for creating and scheduling a data pipeline with transformation options.
Official list of open source tools endorsed by the Digital Public Goods Alliance. This tool is part of this registry.
Article presenting the global alliance to promote digital public goods and its relationship with the IDB.
