
Language
Python
Tool Type
API
License
AM331-A3
Version
1.0.0
Inter-American Development Bank

DataIntegrationAPI offers advanced functions for inserting, querying and displaying data, both spatial and non-spatial, in multidimensional databases suitable for big data. It is integrated with DataViewer to facilitate the creation of dynamic visualizations in web applications. Developed to improve the diagnosis of municipal data and support the Vem pro Centro Program, this API promotes the use of big data in smart cities, offering flexible tools for the construction and visualization of databases.
DataIntegrationAPI facilitates the integration and visualization of large volumes of data, helping municipalities and organizations use big data to improve decision making and optimize data diagnostic processes.
Data Integration: DataIntegrationAPI offers tools to integrate data from different sources, making it accessible for analysis and visualization. API Access: Developers can often access the API to build custom data integration and visualization solutions. Customization: Users can customize DataIntegrationAPI to suit their specific data integration and visualization needs.
Developed in Jupyter Notebook, this tool enables data integration and analysis in an interactive Python-based environment.
Connect with the Development Code team and discover how our carefully curated open source tools can support your institution in Latin America and the Caribbean. Contact us to explore solutions, resolve implementation issues, share reuse successes or present a new tool. Write to [email protected]
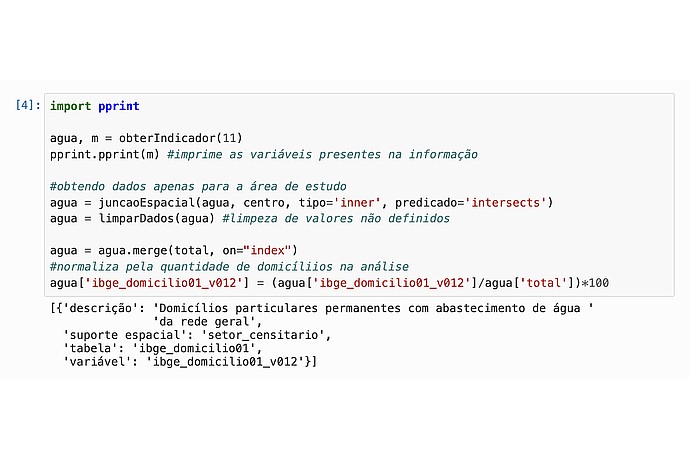
This image shows a code snippet in a Jupyter Notebook, where Python code is used for data processing, including obtaining, cleaning, and normalizing data for analysis.
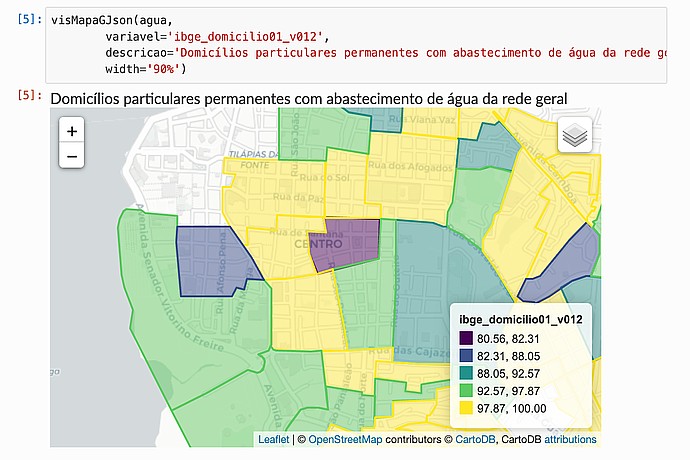
This image shows a heatmap visualization within a Jupyter Notebook cell, representing the distribution of permanent private households with access to general water supply.
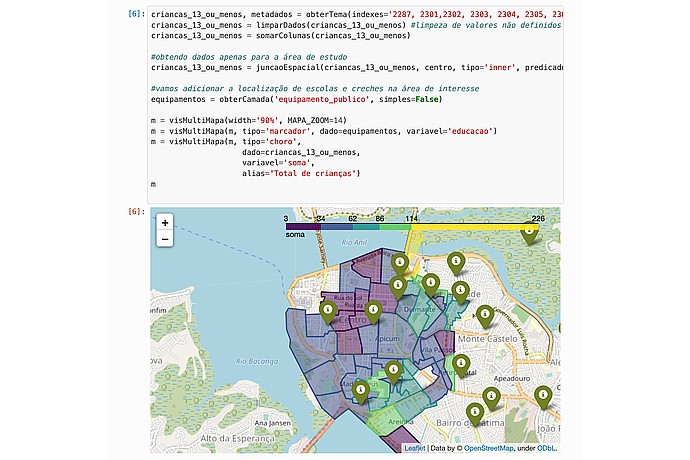
A map displays areas with shades and numbers representing the sum of children under 13. Markers with info icons highlight schools, nurseries. OpenStreetMap is used.
Image of the implementation of the tool in the city of São Luís as a Smart City.
Code4Dev Webinar: Discover DataIntegrationAPI
IDB Technical Cooperation to support Brazilian cities with data-based tools.
Guide to support the diagnosis of town hall data with flexible visualization.