
Language
Python
Tool Type
Web app
License
AM331-A3
Version
1.0.0
Inter-American Development Bank

DataViewer, maintained by DataIntegrationAPI, enables automated creation of thematic maps, graphs, and data analysis. Configurable to fit specific needs, this tool transforms data visualization into an intuitive and accessible process. Essential for simplifying data analysis and functional prototyping, DataViewer assists analysts in the interactive visualization of urban data, improving the understanding and management of smart city projects.
DataViewer simplifies the creation and configuration of complex data visualizations, making it easier for analysts to interpret and manage large volumes of spatial and non-spatial information.
Data Visualization: DataViewer offers a range of visualization tools to present data in a clear and informative manner. Customization: Users can often customize DataViewer to meet their specific data analysis and visualization needs.
Integrates database operations: uses PSYCOPG2 for efficient database interaction. Manages geospatial data: employs libraries like Fiona, Geopandas, and Sqlalchemy to handle and process geospatial information. Facilitates data visualization: incorporates tools like folium and plotly.express for creating interactive visualizations. Establishes global variables: uses a dedicated module without external dependencies for global variable configuration. Adopts JSON for data exchange, ensuring interoperability and open standards.
Connect with the Development Code team and discover how our carefully curated open source tools can support your institution in Latin America and the Caribbean. Contact us to explore solutions, resolve implementation issues, share reuse successes or present a new tool. Write to [email protected]
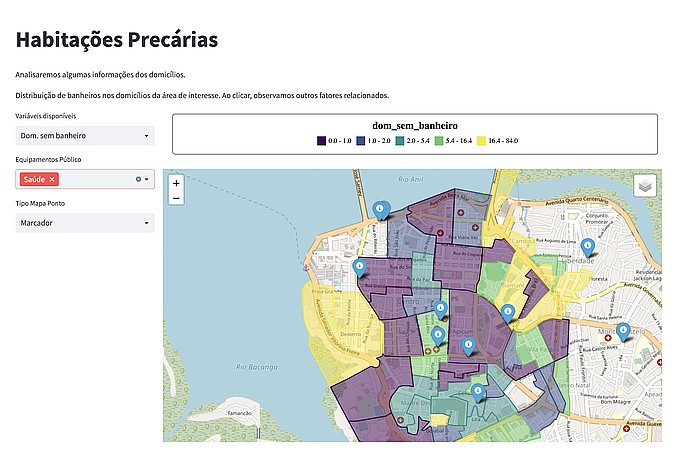
"Precarious Housing" map shows areas in colors indicating homes without bathrooms, ranging from 0.0 to 84.0. It highlights the "Health" option and various points marked in blue on the map.
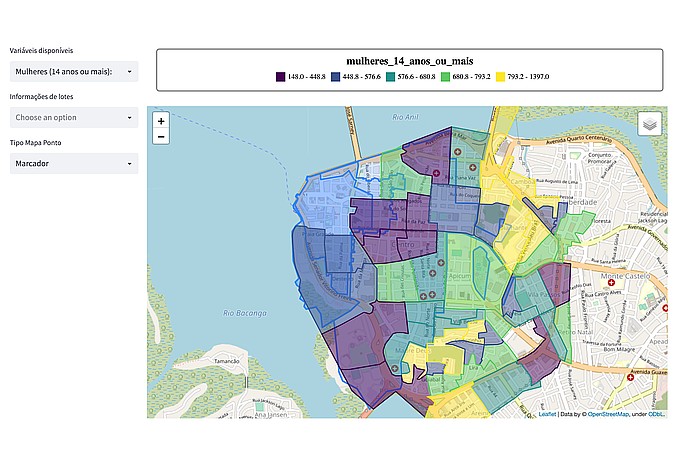
Map of regions colored by the number of women aged 14 or above. Categories range from 148.0 (purple) to 1397.0 (yellow). Controls for variables and map type on the left.
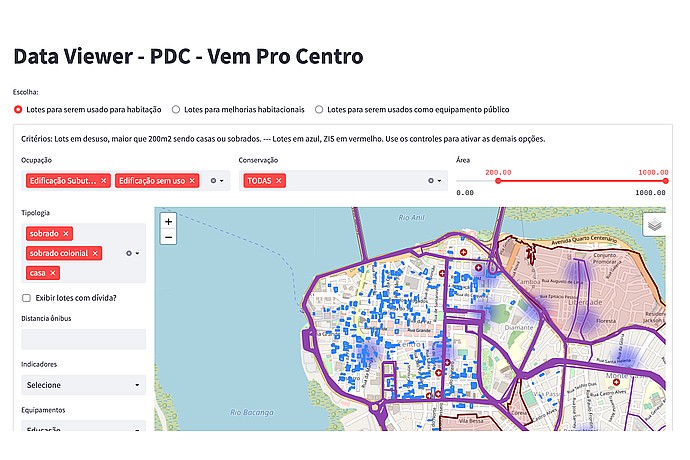
"Data Viewer - PDC - Vem Pro Centro" interface with options to select lots for residential or public use. Displays a map with areas in blue and red, and filters for occupancy and typology.
Visualization of the use of the tool in the Vem pro Centro urban program.
Code4Dev: Get to know DataViewer
IDB Technical Cooperation to support Brazilian cities with data-based tools.
API module functions organized into queries, inserts and views.