
Language
R
Tool Type
Algorithm
License
AM331-A3
Version
1.0.0
Inter-American Development Bank

EGP is an analytical tool designed to evaluate the territorial impact of public programs, both on people and on territories. It facilitates the adjustment of public policies by analyzing how programs aimed at people affect the territory and vice versa, with the aim of improving the quality of life. This R package, specifically developed for the analysis of the Cultural Pass in Buenos Aires, allows geographical visualization and analysis of access to cultural services by young people from public schools. It offers functions to georeference addresses, obtain urban maps, estimate distances and create detailed visualizations of cultural consumption, facilitating the evaluation of the geographic impact of public programs.
EGP solves the challenge of evaluating the territorial impact of public programs on people and territories. It allows policies to be adjusted through reciprocal analysis between programs and their territorial effect, in order to improve the quality of life. Developed for the analysis of the Cultural Pass in Buenos Aires, it facilitates the evaluation of access to cultural services and the geographical visualization of the impact of these programs.
Project Planning: EGP supports project planning with tools for defining objectives, timelines, budgets, and key performance indicators. Resource Management: Users can efficiently allocate and manage project resources, including personnel and budgets. Monitoring and Evaluation: The platform allows for real-time monitoring and evaluation of project progress and outcomes. Reporting and Analytics: GPE offers comprehensive reporting and analytics to derive insights from project data.
Developed with R, it leverages its environment for statistical calculations and graphics. Utilizes GGPLOT2 to create complex graphics based on the grammar of graphics, aligning with open-source principles. Incorporates GGMAP to integrate maps into graphics, ensuring compatibility with open standards. Employs Knitr to generate dynamic reports, promoting reproducibility in research. Adopts open-source technologies to foster interoperability and collaboration in the scientific community.
Connect with the Development Code team and discover how our carefully curated open source tools can support your institution in Latin America and the Caribbean. Contact us to explore solutions, resolve implementation issues, share reuse successes or present a new tool. Write to [email protected]
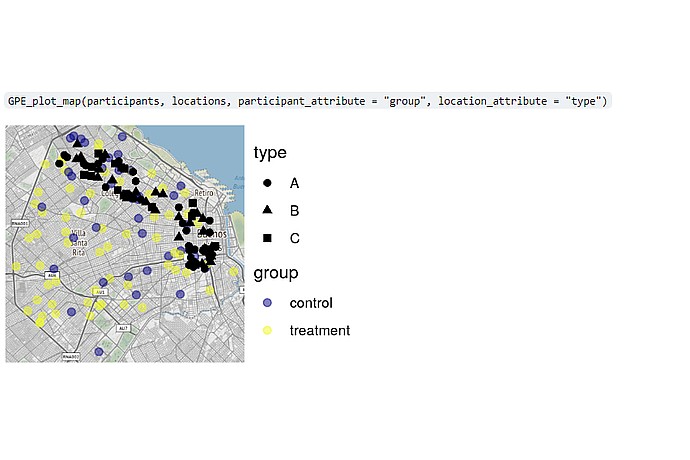
Map with points and shapes in various colors and styles. Shapes (circles, triangles, squares) represent types A, B, C. Colors (blue, yellow) indicate groups: control, treatment.
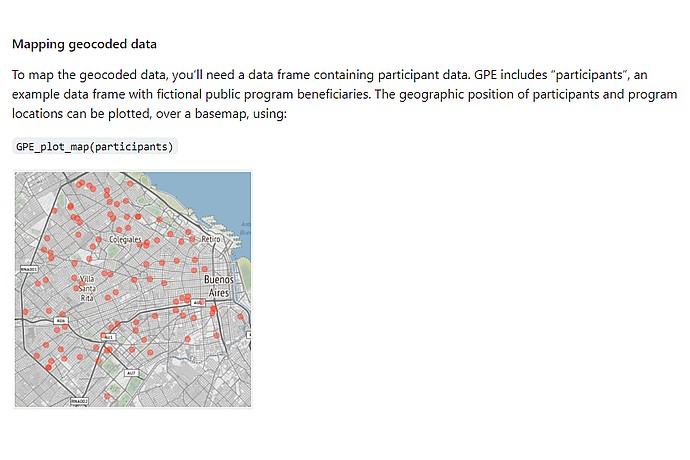
This image depicts a map of Buenos Aires with red markers, demonstrating the use of a function to plot geocoded data, likely representing participant locations.
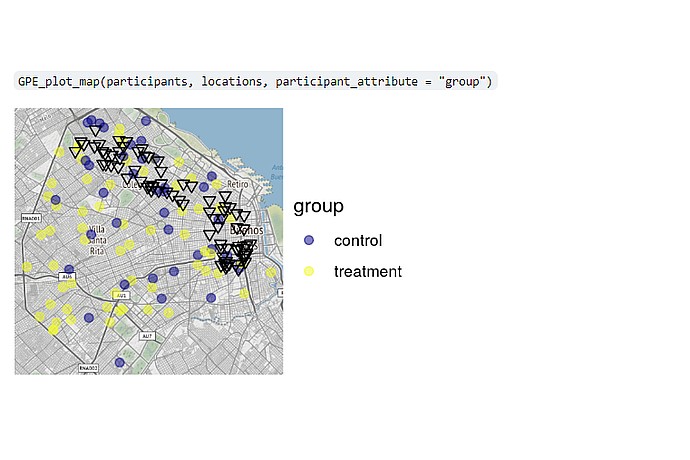
This image depicts a map visualization generated by code, likely Python, showing the distribution of control and treatment groups across a geographical area.
IDB project for urban innovation in LAC.
Information from the Ministry of Culture of Buenos Aires.
IDB projects on urban planning and more.