
Language
R
Tool Type
Algorithm, Manual
License
AM331-A3
Version
1.0.0
Inter-American Development Bank

The Guide to Creating Socioeconomic Maps is a markup language manual that uses R to produce maps using geolocated information from satellite images or other sources. This document covers from the preprocessing of the information to the final calculation of the map. This guide was developed to facilitate access to creating socioeconomic maps using free geolocated data. It is shared to extend its methodology and support political decision-making through the efficient use of maps.
The Socioeconomic Mapping Guide solves the complexity of generating detailed maps using geolocated data. It facilitates the process from data collection to visualization, supporting effective policy decision-making.
Comprehensive Tutorials: The guide offers step-by-step tutorials and best practices for spatial modeling using open-source tools and software. Data Preparation: Users can learn how to prepare and clean geospatial data for analysis. Spatial Analysis Techniques: The guide covers a range of spatial analysis techniques, including spatial autocorrelation, interpolation, and geostatistics. Population Modeling: Users can explore methodologies for modeling population distribution and density. Welfare Indicators: The guide includes tutorials on modeling welfare indicators and their spatial distribution. Customization: Users can adapt the techniques and tools to their specific research or policy analysis needs. Documentation: Comprehensive documentation available on the guide's website assists users in understanding and implementing spatial modeling techniques effectively.
Technical guide using Docker, Makefile, and Jupyter Notebooks for environment setup. Includes R functions for managing dependencies. Presented as a static website using HTML, CSS, and JavaScript.
Connect with the Development Code team and discover how our carefully curated open source tools can support your institution in Latin America and the Caribbean. Contact us to explore solutions, resolve implementation issues, share reuse successes or present a new tool. Write to [email protected]
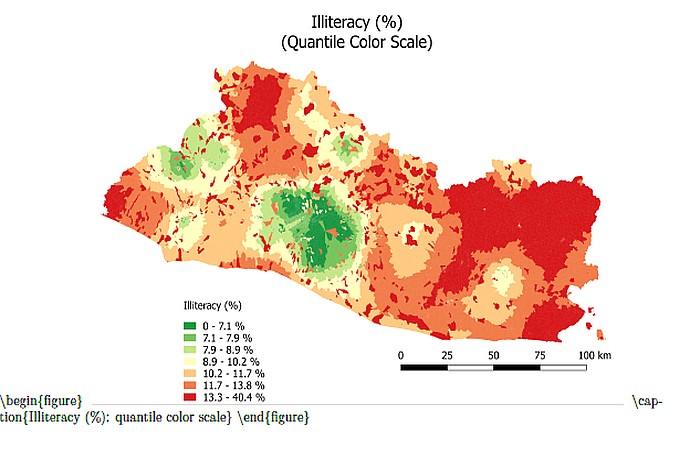
This image depicts a geographical heat map showing the percentage of illiteracy across a region, using a quantile color scale to represent different levels.
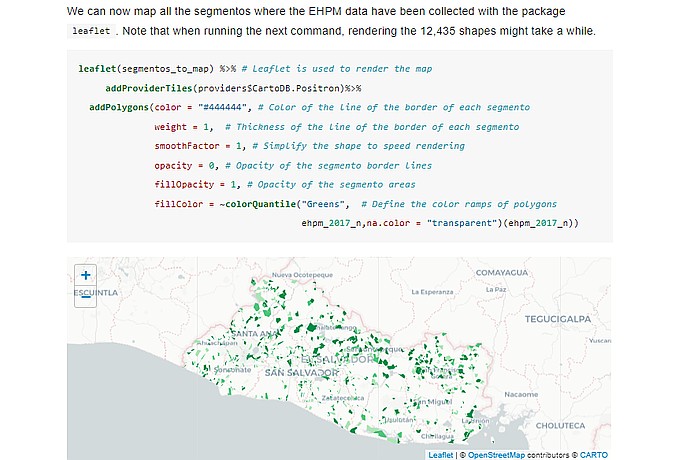
This image showcases a Leaflet map in code and its visual output, plotting data points with geospatial information gathered from the EHPM dataset.
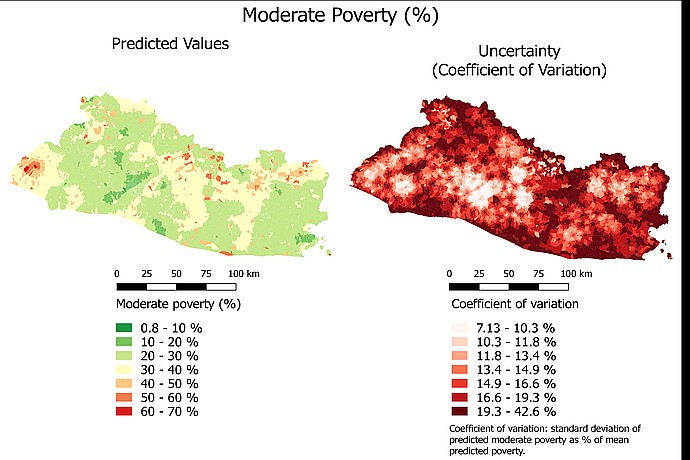
Map of moderate poverty in % (left) and variation coefficient (right) of a region. Green to red colors indicate poverty ranges from 0.8% to 70%. Variation from 7.13% to 42.6%. Use km scales.
Create socioeconomic maps with R and open data.