Language
Javascript
Tool Type
Web app
License
AM331-A3
Version
1.0.0
Inter-American Development Bank

IDB Energy Visualizations is an interactive database that allows you to observe and compare energy production and consumption, along with regulatory frameworks, over time in IDB member countries and other significant states. Its intuitive design makes it easy to understand and analyze complex energy data. Developed to support decision makers and the general public, this tool offers a means to explore and compare energy evolution between nations. We share this database to promote informed analysis and encourage more effective energy policies globally.
Energy Visualizations IDB addresses the need to understand and compare energy policies and their evolution, providing a platform that visualizes this data in a clear and accessible way.
Interactive Dashboards: The platform offers interactive dashboards with a wide range of energy-related data, including consumption, production, renewable energy sources, and emissions. Customizable Visualizations: Users can customize visualizations to focus on specific energy indicators and regions, tailoring the data to their needs. Data Exploration: Visualizaciones de Energia BID enables users to explore historical trends, compare data across regions and time periods, and gain insights into energy-related patterns. Geospatial Mapping: Geographic information system (GIS) integration allows users to view energy data on interactive maps, providing a spatial context for energy analysis. Data Downloads: Users can download datasets for further analysis and research, promoting data transparency and open access.
Offers interactive dashboards with energy data on consumption, production, and emissions. Integrates geospatial maps and allows users to customize visualizations, explore historical trends, and download data for analysis.
Lorem ipsum
Lorem ipsum
Connect with the Development Code team and discover how our carefully curated open source tools can support your institution in Latin America and the Caribbean. Contact us to explore solutions, resolve implementation issues, share reuse successes or present a new tool. Write to [email protected]
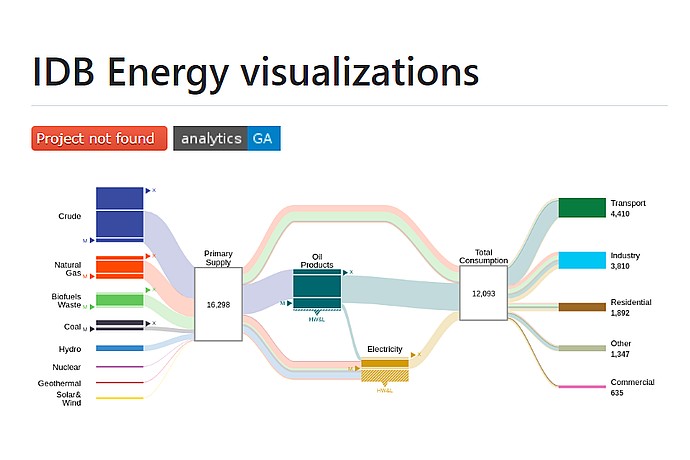
BID Energy Visualization: shows the energy flow from primary supply (16,298) to oil products and electricity, to total consumption (12,093) in transportation, industry, and more.
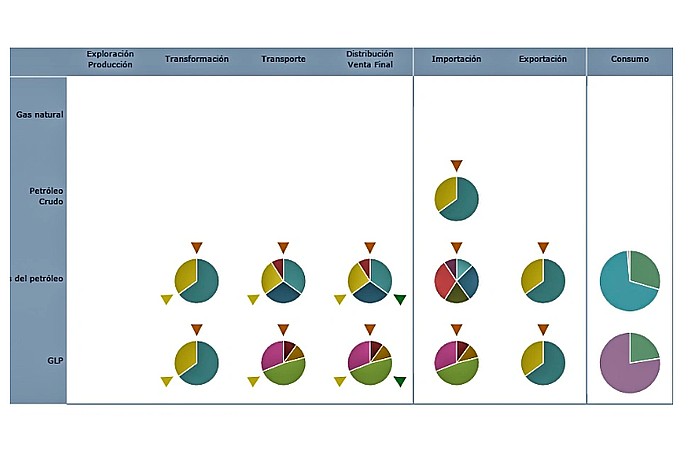
Energy flow diagram: displays stages (production, transformation, transport, distribution, import, export, consumption) of natural gas, oil, derivatives, and LPG with pie charts.
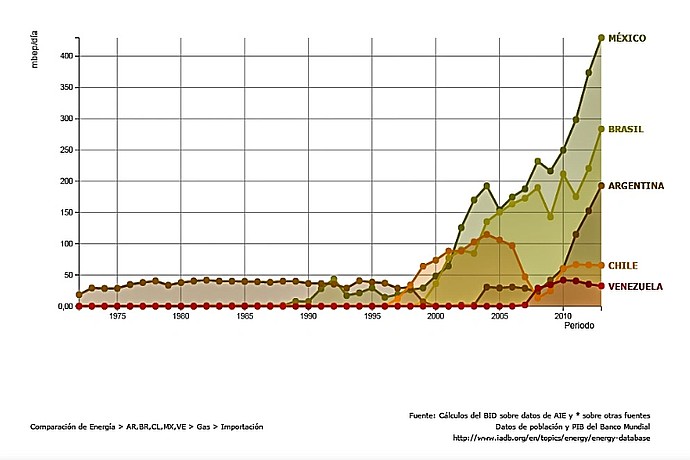
Line graph showing gas imports in mtep/capita from 1975 to 2010 for Mexico, Brazil, Argentina, Chile, and Venezuela. Mexico notably grows, followed by Brazil and Argentina. Chile and Venezuela remain low.
It presents how the IDB has opened data on the energy matrix in the region, highlighting the importance of the tool.