
Language
R
Tool Type
Algorithm, API
License
AM331-A3
Version
1.0.0
Inter-American Development Bank

idbsocialdata Libraries offers packages in R, Stata and python to quickly obtain comparable indicators between countries and over time, covering areas such as poverty, health, education and more. These indicators come from various sources such as household surveys and censuses, facilitating regional analysis. Developed to provide a unified source of regional data, these tools enable quick queries of diverse indicators, driving research and informed decision-making. The tool is shared to improve the IDB's social indicators and accelerate research in Latin America and the Caribbean.
idbsocialdata Bookstores facilitates access to key social indicators for the region, allowing quick and efficient comparisons between countries and over time. Improves research and decision making by providing reliable and comparable data in seconds.
Extensive Datasets: Users can access a wide variety of datasets related to social and economic topics in Latin America and the Caribbean. Data Exploration: The platform offers tools for data exploration, visualization, and analysis to extract meaningful insights. Data Access: Users can freely access and download the datasets for research and analysis. Data Integration: Data can be integrated into various analytical tools and software for further research. Documentation: idbSocialData typically provides documentation to assist users in understanding and utilizing the data.
Built with R, it leverages this programming language for statistical and data analysis. Requires R version 3.3 or higher, ensuring compatibility with the latest updates. Integrates magrittr to facilitate code writing through pipe operators. Utilizes dplyr for data manipulation and transformation, and tidyr for data cleaning and organization. Recommends readr for efficient text file reading and SF for spatial data handling. Implements testThat for unit testing, ensuring code quality.
Connect with the Development Code team and discover how our carefully curated open source tools can support your institution in Latin America and the Caribbean. Contact us to explore solutions, resolve implementation issues, share reuse successes or present a new tool. Write to [email protected]
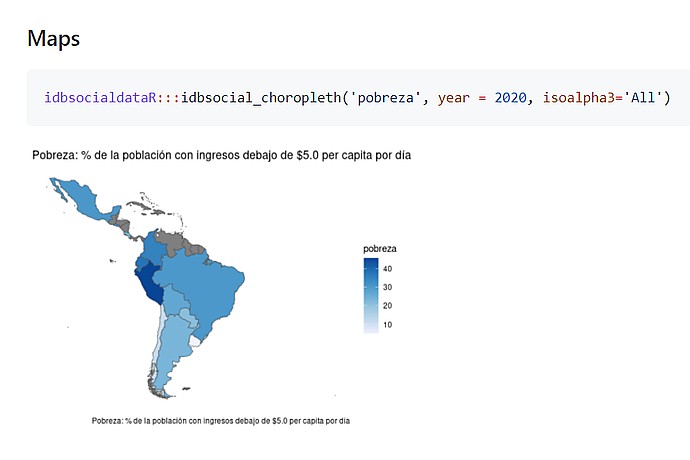
Latin America map showing poverty in 2020, with color key: light blue (10% poverty) to dark blue (40%). Text: percentage of people with less than $5 daily. R code used: idbsocial_choropleth.
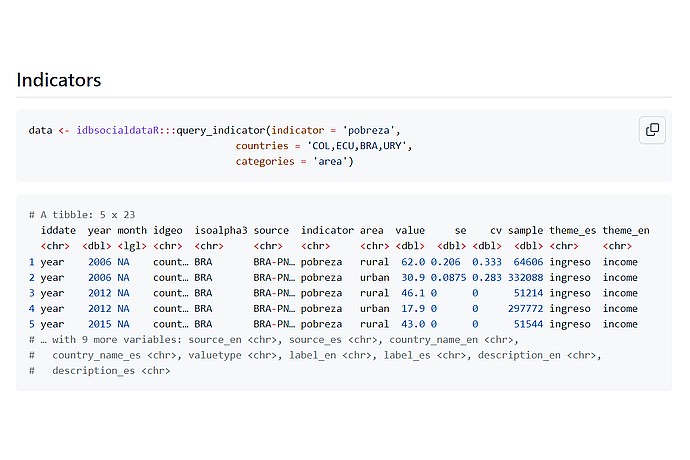
R code to query poverty indicators in Colombia, Ecuador, Brazil, and Uruguay, categorized by area. Displays annual rural and urban poverty values in Brazil from 2006, 2012, and 2015.
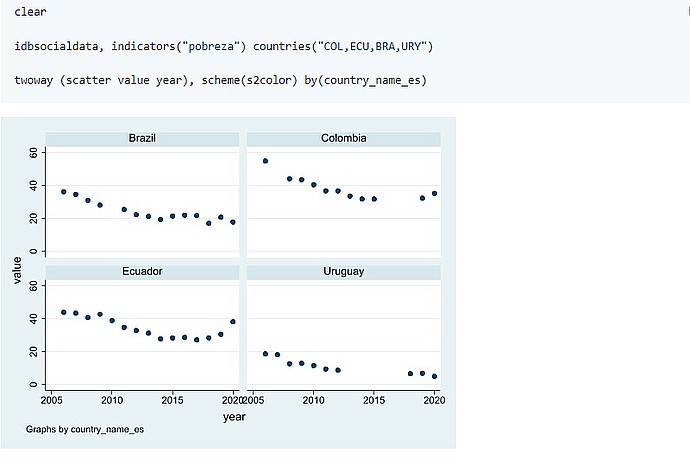
Scatter plot with poverty data from Brazil, Colombia, Ecuador, and Uruguay between 2005 and 2020. Each country has its own graph with descending points in all four cases. Commands from "idbsocialdata".
Harmonized demographic, economic and social data for 26 LAC countries.
Code4Dev: Learn how to implement the open source tool IDBSocialData and Code4Dev: Learn about IDB Social Data