
Language
R
Tool Type
Algorithm
License
AM331-A3
Version
1.0.0
Inter-American Development Bank

The Indicator Aggregator is an R library developed by the IDB, designed to analyze and compare indicators from various sources and units of measurement. This tool makes it easy to search for data related to keywords, turning hundreds of indicators into valuable information for decision making. Initially created as part of the Gender Dashboard project to make visible the gaps in gender indicators, it allows the extraction and normalization of indicators from multiple sources, adapting to the analytical needs of academics, NGOs and other entities interested in detailed data analysis.
This Aggregator faces the challenge of effectively analyzing and comparing indicators from multiple sources. It transforms data into useful information for decision-making, allowing gaps in gender indicators and other sectors to be visualized, facilitating effective strategic analysis.
Enables searching for development indicators across multiple databases. Allows comparison of indicators with various units of measurement. Facilitates efficient data analysis for development studies. Provides a unified interface for accessing diverse data sources. Enhances the usability of development data for research and policy-making.
Built as an R library, it enables seamless integration into data analysis workflows. Connects to APIs from development data sources like the World Bank. Utilizes WBSTAT, WDI, HTTR, and JSONLITE for managing API connections and data. Facilitates data manipulation tasks such as merging and filtering. Embraces an open-source approach, encouraging community contributions and improvements.
Connect with the Development Code team and discover how our carefully curated open source tools can support your institution in Latin America and the Caribbean. Contact us to explore solutions, resolve implementation issues, share reuse successes or present a new tool. Write to [email protected]
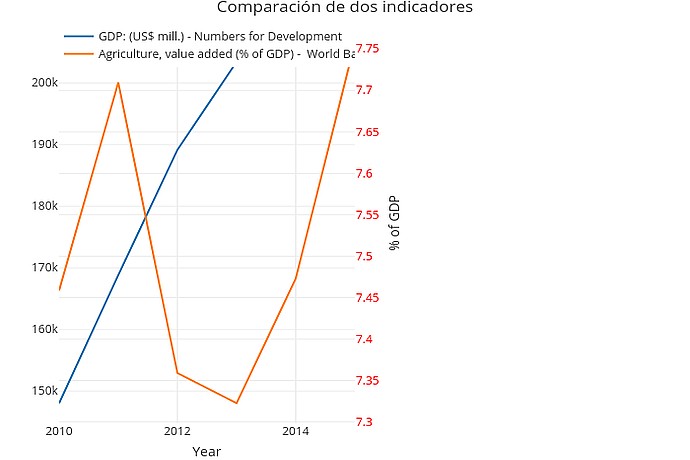
This image displays a dual-axis line graph titled "Comparación de dos indicadores," comparing GDP in US$ million and agriculture value added as a percentage of GDP over time.
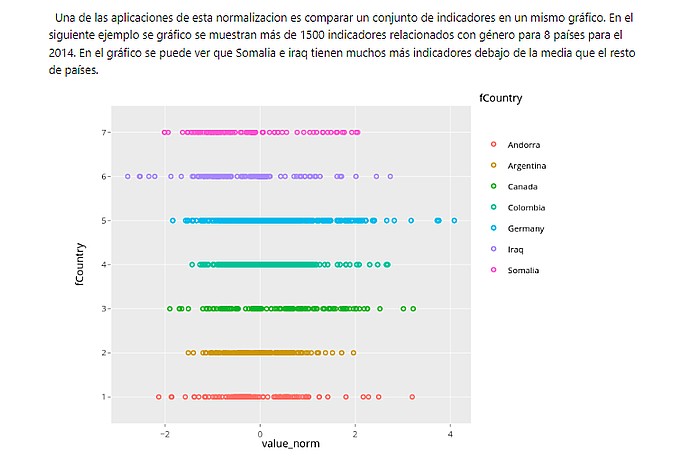
Scatter plot with data from 8 countries (Andorra, Argentina, Canada, Colombia, Germany, Iraq, Somalia) showing over 1500 gender indicators for 2014. X-axis: "value_norm", Y-axis: countries. Indicates variations, highlighting Somalia and Iraq with more indicators below average.
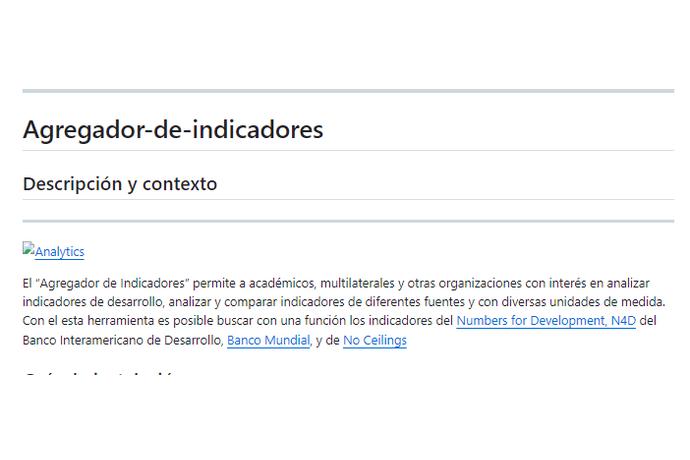
This image displays a description of the "Agregador de indicadores," a tool for analyzing and comparing development indicators from various sources for academics and organizations.
Explanation on the use of the library to analyze development data.
More than 200 Data Sets in our catalog.