
Language
Ruby
Tool Type
Web app
License
AM331-A3
Version
1.0.0
Inter-American Development Bank

Map of LAC Innovators COVID-19 Innovator Mapping is a tool developed by the IDB Laboratory that facilitates the transmission of new data captured in CSV format to a dynamic and navigable table on a web page, updated in real time. This tool allows you to view, classify, filter data and download content, offering a clear vision of the ecosystem of entrepreneurs in Latin America and the Caribbean and their innovative responses to COVID-19. It is an open solution that leverages Javascript libraries to present data in an accessible way.
LAC COVID-19 Innovator Mapping solves the difficulty of accessing and managing geographic and innovation data effectively during the pandemic. It provides an alternative interface to view and navigate this data, improving understanding of the impact and regional responses to COVID-19.
Interactive Map: The platform offers an interactive map that allows users to explore innovative COVID-19 initiatives across LAC. Filter and Search: Users can filter and search for initiatives by region, sector, and focus area, making it easy to find relevant projects. Detailed Profiles: Each initiative is presented with a detailed profile, highlighting its objectives, impact, and contact information. Collaboration Hub: The platform serves as a hub for innovators, policymakers, and stakeholders to connect, collaborate, and share best practices. Open Data Sharing: It adheres to open data standards, ensuring transparency and accessibility in showcasing innovative COVID-19 responses.
Implements web technologies: uses JavaScript and HTML to create an interactive web interface. Incorporates open-source libraries: jQuery, Bootstrap, Bootstrap Table, jQuery CSV, and Chart.js to enhance interface dynamics and data visualization. Facilitates data access: allows data visualization, filtering, and downloading through web interfaces. Supports data export: offers CSV and XLSX formats for data export. Provides Python and R scripts for programmatic data access. Hosts data on ArcGIS: enables direct access via URL for visualiz
Connect with the Development Code team and discover how our carefully curated open source tools can support your institution in Latin America and the Caribbean. Contact us to explore solutions, resolve implementation issues, share reuse successes or present a new tool. Write to [email protected]
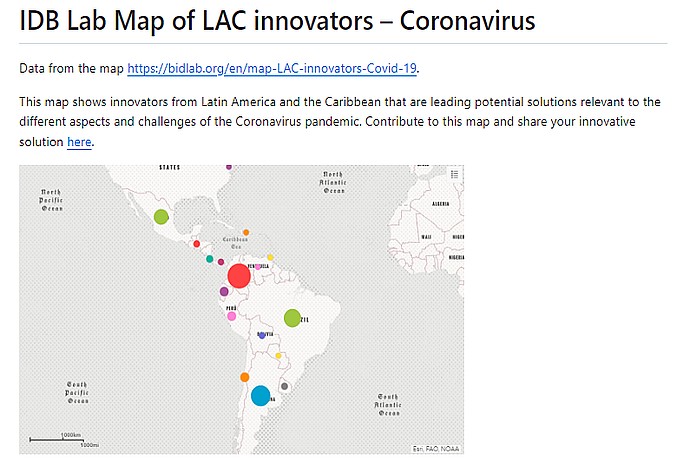
This image shows a map titled "IDB Lab Map of LAC innovators – Coronavirus," displaying various colored dots across Latin America and the Caribbean, indicating locations of innovators addressing challenges of the COVID-19 pandemic.
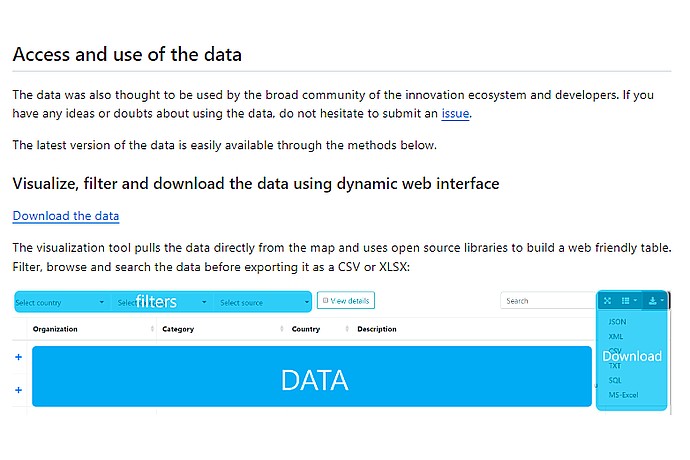
"Mapeo de Innovadores LAC COVID-19" page, with instructions to download data. Offers filters by country, category, and source. Allows exporting to CSV, XLSX, JSON, XML formats, and more.
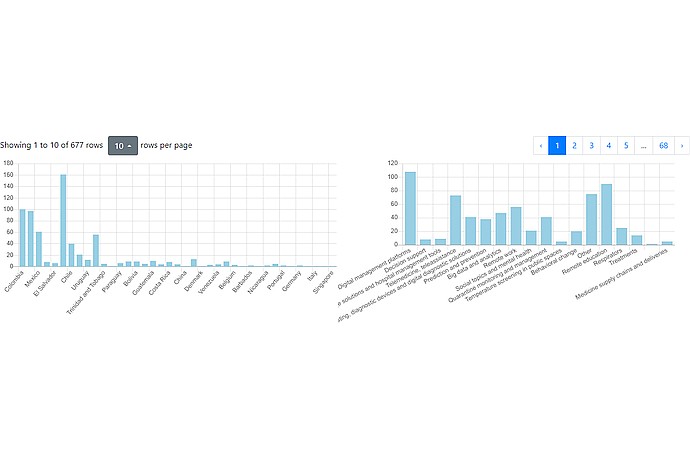
This image shows two bar charts displaying data distributions across various categories, likely from a database or data analysis output with pagination controls.
Interactive visualization that allows you to explore and filter innovative initiatives in the region related to the pandemic.
Article that describes the purpose and functionalities of the map, as well as its impact on the region.