Language
Python
Tool Type
Web app
License
The MIT License
Version
1.0.0
UNDP

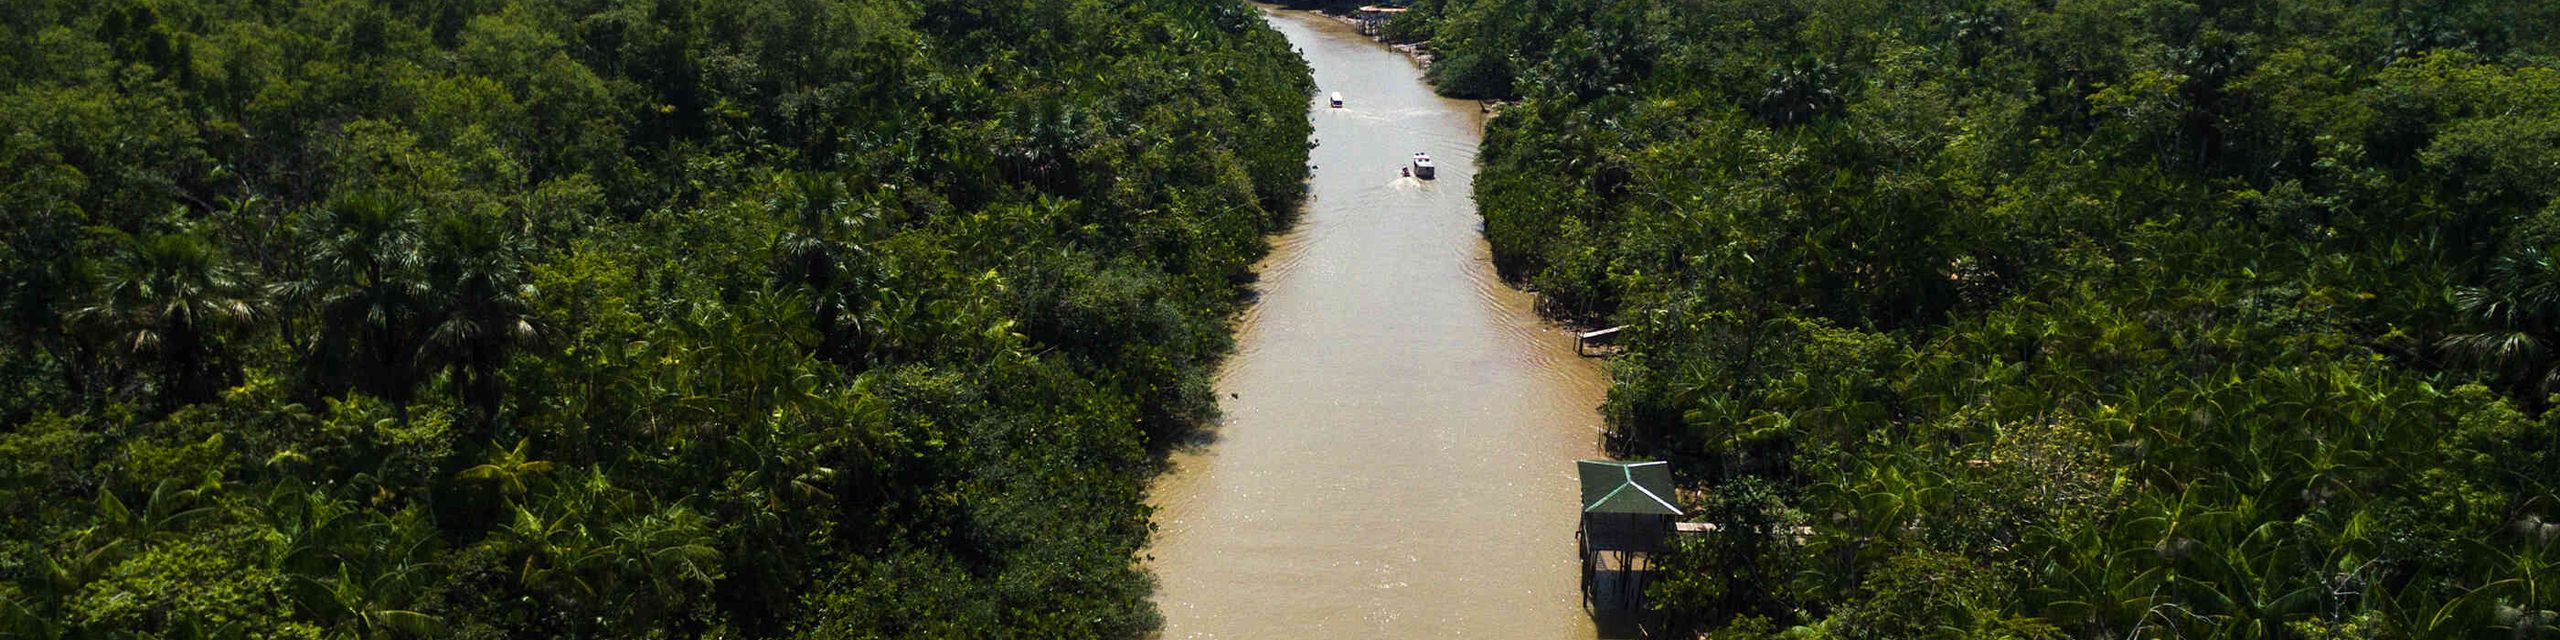
Mapping Lomas is a project that uses satellite image technology to analyze the vegetation cover on the hills, identifying areas of greening and evaluating geographic factors such as orientation and altitude. By providing accurate vegetation data, this project supports environmental conservation and territorial planning. Their approach allows scientists and planners to gain a detailed understanding of the Lomas ecosystem, facilitating conservation efforts and helping to mitigate the impacts of climate change on these unique habitats.
Mapping Lomas responds to the need for detailed information on vegetation cover in lomas ecosystems. It uses satellite technology to provide accurate data that supports environmental conservation and territorial planning, allowing effective management of these vulnerable ecosystems.
Satellite Data Analysis: Utilizes MODIS imagery to study vegetation patterns. Time-Series Examination: Analyzes vegetation changes over a period of at least 20 years. Geographic Correlation: Investigates the influence of altitude, slope, and orientation on vegetation. Vegetation Mapping: Generates detailed maps showing vegetation frequency and distribution. Statistical Graphs Creation: Develops graphs to illustrate the correlation between vegetation and geographic factors. Data Visualization: Employs advanced visualization techniques for clear representation of findings.
Incorporates Modis satellite images for environmental analysis using moderate-resolution imaging spectroradiometer data. Applies NDVI metrics to accurately assess vegetation health. Implements Jupyter Notebooks to facilitate data analysis and visualization through modular Python notebooks. Employs advanced techniques for geospatial data processing, ensuring efficient information management. Follows a sequential analysis approach for comprehensive study. Utilizes visualization libraries like Matplotlib and Plotly for interactive and c
Connect with the Development Code team and discover how our carefully curated open source tools can support your institution in Latin America and the Caribbean. Contact us to explore solutions, resolve implementation issues, share reuse successes or present a new tool. Write to [email protected]
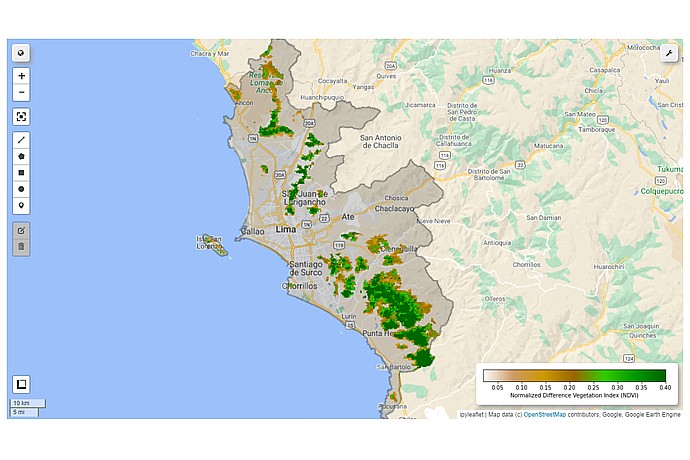
Lima map shows the Normalized Difference Vegetation Index (NDVI) in shades of green and brown. Green areas indicate denser vegetation. Scale of 0 to 0.4 NDVI bottom right.
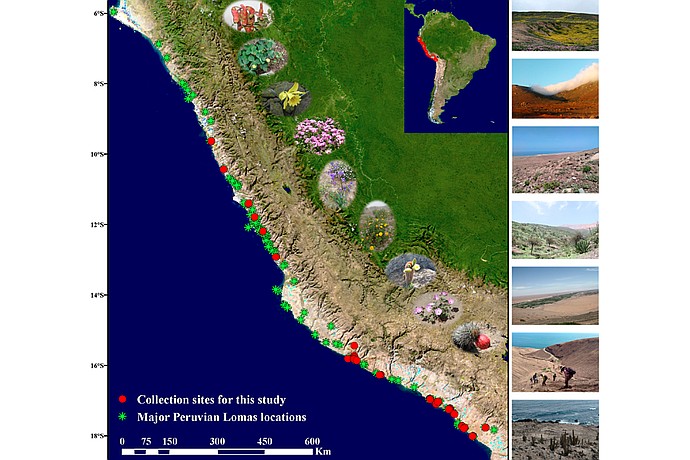
This image displays a map of Peru showing the locations of Lomas ecosystems, with markers indicating collection sites for a study, alongside various photographs of the landscapes.
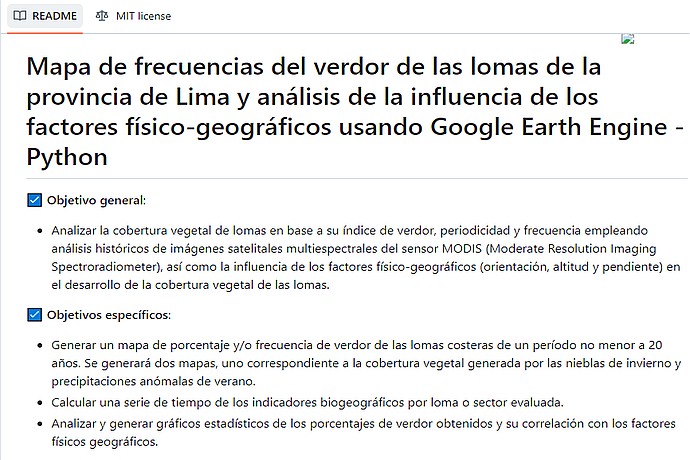
This image displays a README document outlining the objectives of a project analyzing vegetation cover in the Lomas of Lima province using Google Earth Engine and Python.
Discuss how maps help preserve the unique ecosystems of the lomas in Peru.