
Language
Javascript
Tool Type
Web app
License
AM331-A3
Version
1.0.0
Inter-American Development Bank

Real Estate Data Collection is a web application that systematizes the capture of real estate prices over time, consolidating a spatial database of these values. Using WEB-GIS technology and various free software GIS solutions, this tool offers an adaptable and scalable data visualization platform. It is designed to improve revenue administration and help in the design of more progressive tax systems, being very useful for tax policy makers and tax officials.
This tool was implemented to improve the accuracy and accessibility of real estate data, essential for decision makers in the formulation of fiscal policies and progressive tax systems.
Data Collection Templates: Real Estate Data Collector offers customizable data collection templates to gather property information efficiently. Geographic Information System (GIS) Integration: The tool can integrate with GIS data for spatial analysis and mapping of real estate data. Data Validation: Users can validate and standardize data inputs to ensure accuracy and consistency. Reporting and Analytics: Generate comprehensive reports and perform data analytics to derive insights from collected data.
Implements a multi-layer architecture pattern, utilizing microservices to optimize backend components. Integrates a FLUX model in frontend development to enhance data management. Uses PostgreSQL and PostGIS for spatial data storage and analysis. Adopts web technologies like Vue.js and TypeScript for a dynamic user interface. Incorporates an APIREST to facilitate middleware interactions and HTTP request handling, ensuring interoperability and the use of open formats.
Connect with the Development Code team and discover how our carefully curated open source tools can support your institution in Latin America and the Caribbean. Contact us to explore solutions, resolve implementation issues, share reuse successes or present a new tool. Write to [email protected]
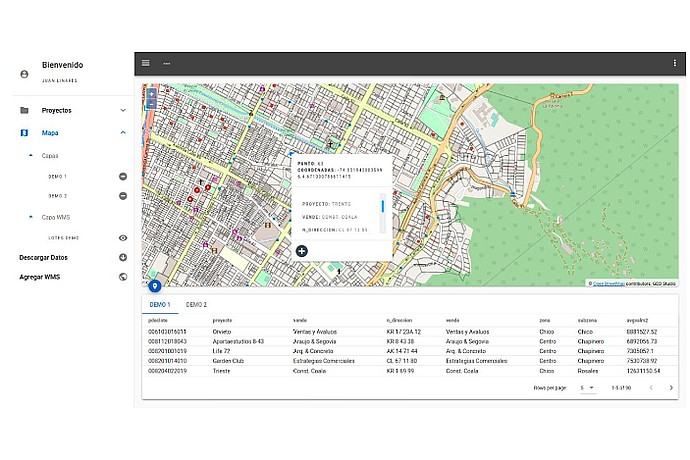
This image displays a GIS interface with a map showing various marked locations, a side panel for project management, and a table with detailed attribute data.
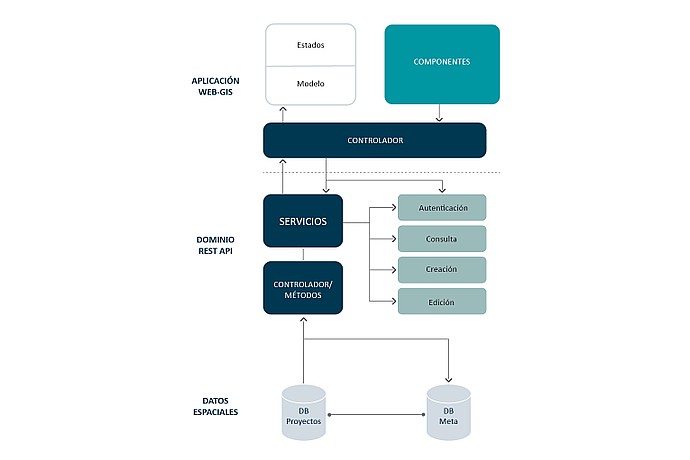
This image depicts a flowchart for a WEB-GIS application, illustrating the components and flow of data from user interface to spatial data
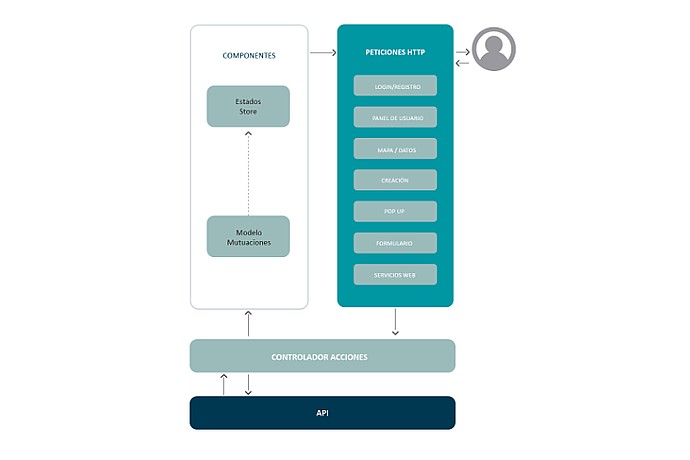
This image depicts a flowchart for HTTP requests handling in software development context. It shows components, actions controller, and API interactions.
Analysis of the use of observatories for local income.
Project on digital solutions for tax administration.